Retail Payment system
Technology Roadmap
Roadmap Overview
The U.S. financial system processes millions of transactions each day to facilitate purchases and payments. In general terms, a payment system consists of the means for transferring money between suppliers and users of funds through the use of cash substitutes, such as checks, drafts, and electronic funds transfers.
A payment system is a system exchanges / trades value by changing the ownership of money. It consists of a set of instruments, banking procedures, and, typically, interbank funds transfer systems that ensure the circulation of money. These systems allow for the processing and completion of financial transactions.
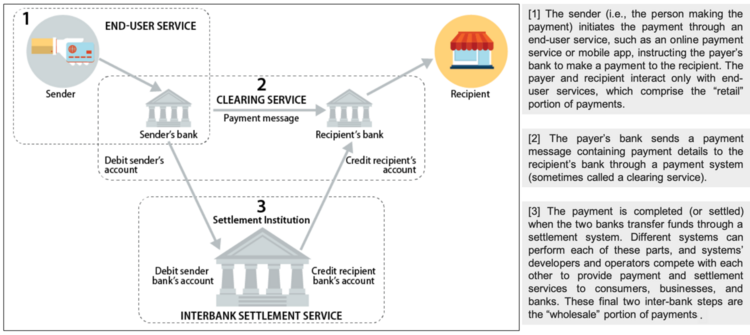
From the typical consumer’s perspective, making a payment is simple. A person swipes a card, clicks a button, or taps a mobile device and the payment is approved within seconds. However, the infrastructure and technology underlying the payment systems are substantial and complex. To simplify, a payment system has three parts (see Figure below).
*image-source - U.S. Payment System Policy Issues: Faster Payments and Innovation, Congressional Research Service (2019)
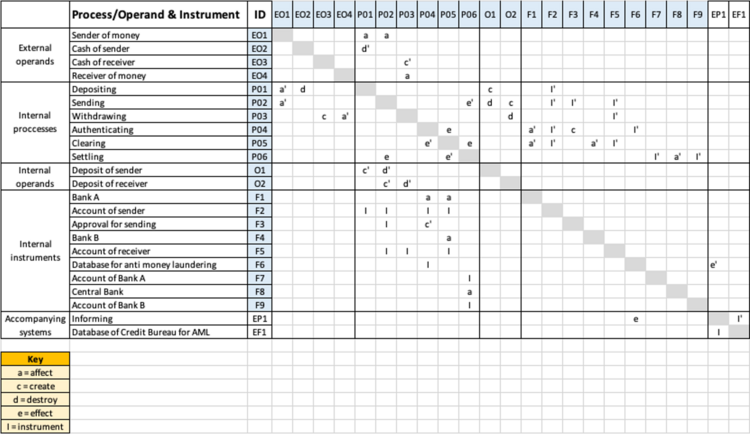
Design Structure Matrix (DSM) Allocation
The DSM of the Retail Payment System provided by banks is depicted in the image below.
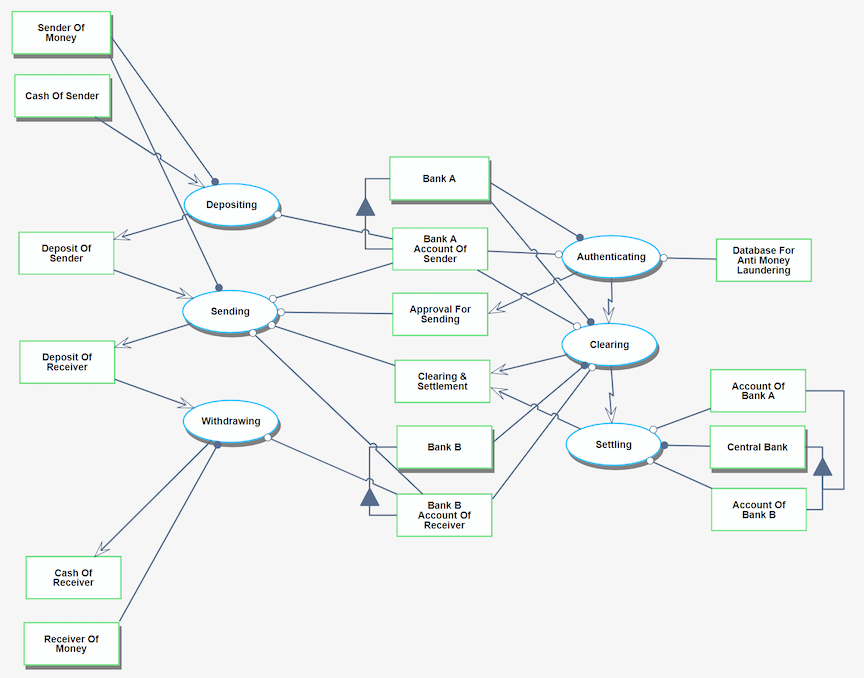
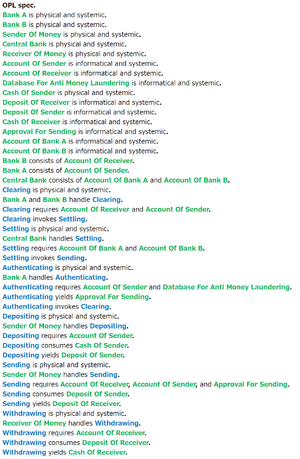
Object Process Model (OPM)
The OPM diagram captures the main object of the roadmap, its decomposition into systems (squares), as well as the main processes (ovals).
Figures of Merit (FOM)
The table below show a list of FOMs by which can assess a Payment System
| Class | Figure of Merit | Units | ||||||||
|---|---|---|---|---|---|---|---|---|---|---|
| Performance | Value of transactions processed per annum | [US$] | ||||||||
| Productivity | Number of transactions processed per annum | # of transactions processed per country, per individual or business client type | ||||||||
| Efficiency | Average cost per transaction | [US cents] | ||||||||
| Transaction settlement period | [Seconds] | |||||||||
| Reliability | System downtime per year | [Seconds] | ||||||||
| Payment conversion rate | [%] | |||||||||
| Safety & Security | Sustainability ratio | [%] of Gross Operating Income that is spend on events to ensure the system is safe, secure and available to users. Within this ratio falls fraud related losses, system downtime, cyber attacks, non-compliance events and user security.
Company Strategic ObjectivesWe identified strategic objectives that can stand the test of time. We want our clients to understand our that we are constant, unchanging, something they can depend. As technology improves, we can change the respective FOM and targets, without changing our strategic objectives. The table below shows our strategic objectives:
|


