File:NZEB Thermal Comfort Tool.jpg
Revision as of 19:47, 7 October 2021 by 916865569CanadyAndrewMichae (talk | contribs) (Thermal comfort indoors: “Psychometric chart” Reveals relationship between Temperature, Airspeed, humidity and comfort.)
No higher resolution available.
NZEB_Thermal_Comfort_Tool.jpg (490 × 424 pixels, file size: 48 KB, MIME type: image/jpeg)
Summary
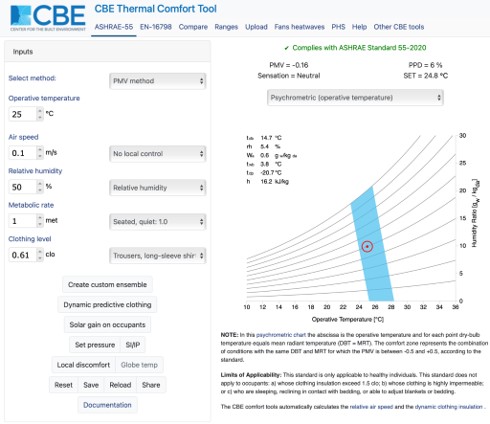
Thermal comfort indoors: “Psychometric chart”
Reveals relationship between Temperature, Airspeed, humidity and comfort.
File history
Click on a date/time to view the file as it appeared at that time.
| Date/Time | Thumbnail | Dimensions | User | Comment | |
|---|---|---|---|---|---|
| current | 19:47, 7 October 2021 | | 490 × 424 (48 KB) | 916865569CanadyAndrewMichae (talk | contribs) | Thermal comfort indoors: “Psychometric chart” Reveals relationship between Temperature, Airspeed, humidity and comfort. |
You cannot overwrite this file.
File usage
The following page uses this file: