Difference between revisions of "Laser Confined Nuclear Fusion"
| Line 34: | Line 34: | ||
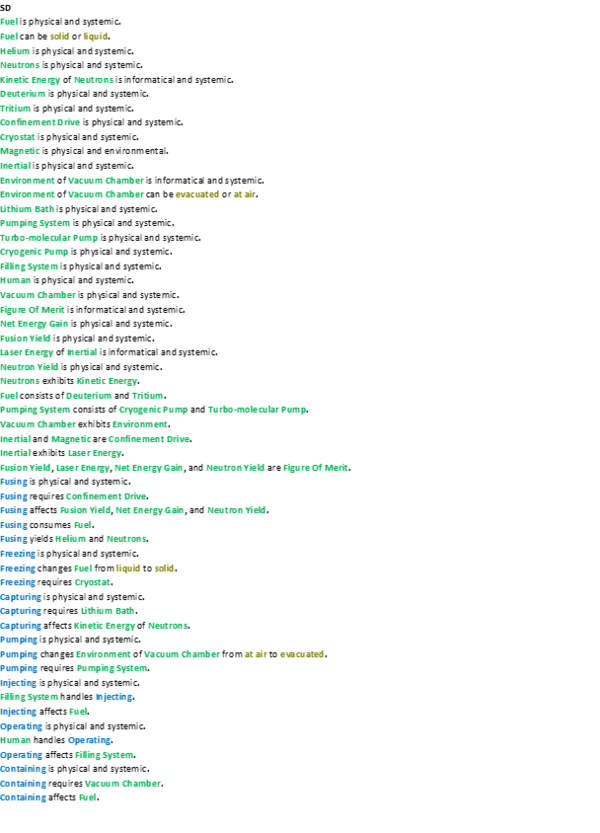
An Object-Process-Language (OPL) description of the roadmap scope is auto-generated and given below. It reflects the same content as the previous figure, but in a formal natural language. | An Object-Process-Language (OPL) description of the roadmap scope is auto-generated and given below. It reflects the same content as the previous figure, but in a formal natural language. | ||
[[File:FusionOPL1.png| | [[File:FusionOPL1.png|600px]] | ||
[[File:Fusion-OPL2.png| | [[File:Fusion-OPL2.png|600px]] | ||
[[File:FusionOPL-3.png| | [[File:FusionOPL-3.png|600px]] | ||
[[File:FusionOPL-4.png| | [[File:FusionOPL-4.png|600px]] | ||
==Figures of Merit== | ==Figures of Merit== | ||
Revision as of 03:27, 29 October 2020
Technology Roadmap Sections and Deliverables
- 2ICF - Laser Confined Nuclear Fusion
Roadmap Overview
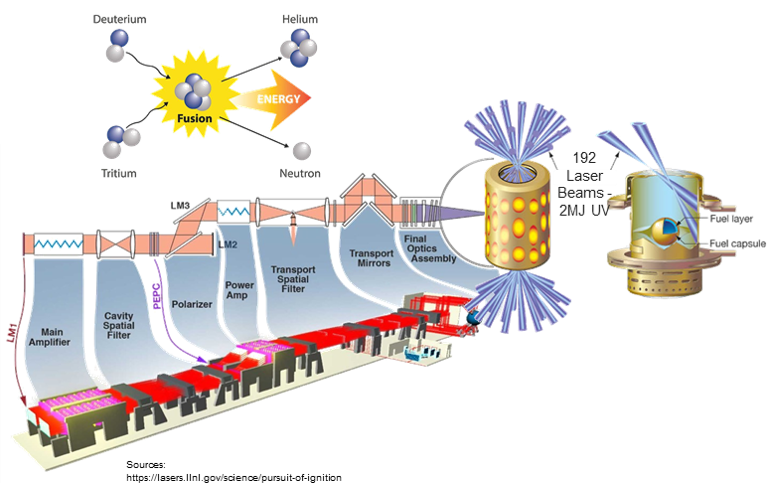
The working principle and architecture of Laser Confined Nuclear Fusion is shown in the schematic below.
Nuclear fusion power generation fundamentally consists of fusing atoms to form heavier ones with a release of energy through neutrons. One of the main technology branches for demonstrating fusion power is Inertial Confinement Fusion, ICF which involves rapidly compressing a D-T (Deuterium-Tritium) fueled target pellet using some of the world’s most powerful lasers. The National Ignition Facility, at LLNL employs 192 UV laser beams at ~2MJ to converge on a gold cylinder, the size of a dime to generate x-rays and accelerate the fuel radially inward in less than 1 billionth to produce helium and high energy neutrons that could be captured to create a future energy source.
Design Structure Matrix (DSM) Allocation
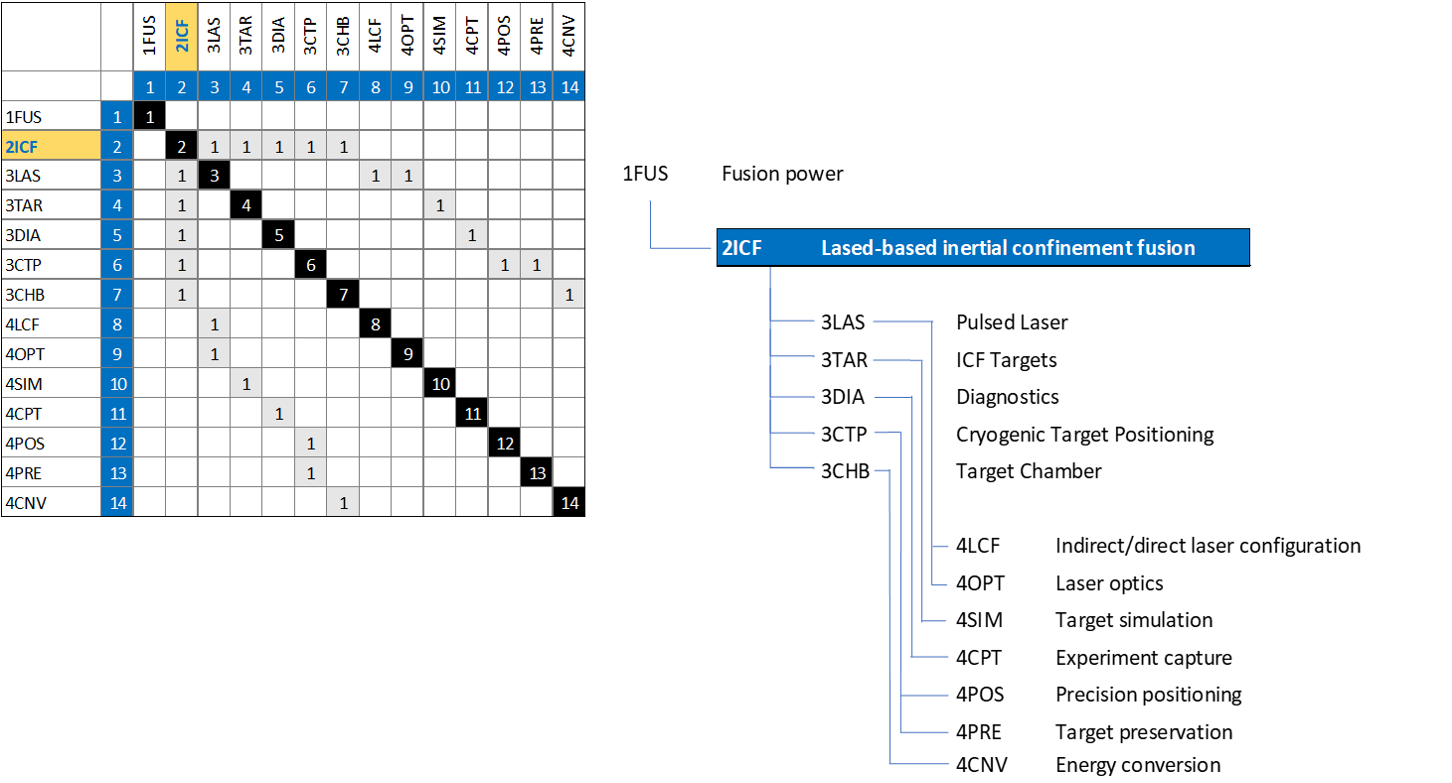
The 2-ICF tree shows us that Laser Confined Nuclear Fusion is part of larger global Nuclear Fusion Power initiative to harness fusion power. The DSM and tree both show that 2-ICF requires the following technologies at the subsystem level 3: 3LAS Laser, 3TAR ICF Targets, 3DIA Diagnostics, 3CTP Cryogenic Target Positioning, and 3CHB Target Chamber. Each level 3 subsystem also require enabling technologies shown as level 4 systems.
Roadmap Model using OPM
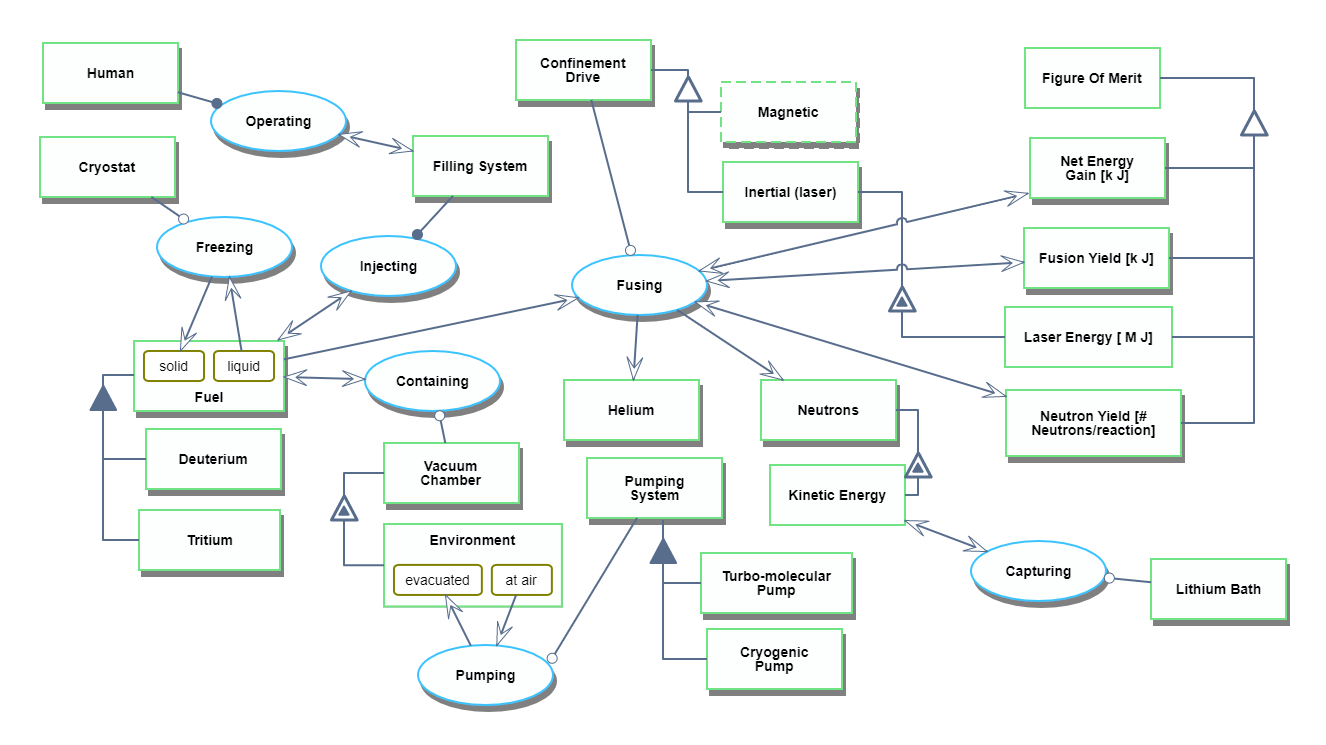
The Object-Process-Diagram (OPD) of the 2ICF Laser Confined Nuclear Fusion is provided in the figure below. This diagram captures the main object of the roadmap, its various processes and instrument objects, and its characterization by Figures of Merit (FOMs). The Fusing Process is unfolded to show sub-processes and their instrument objects.
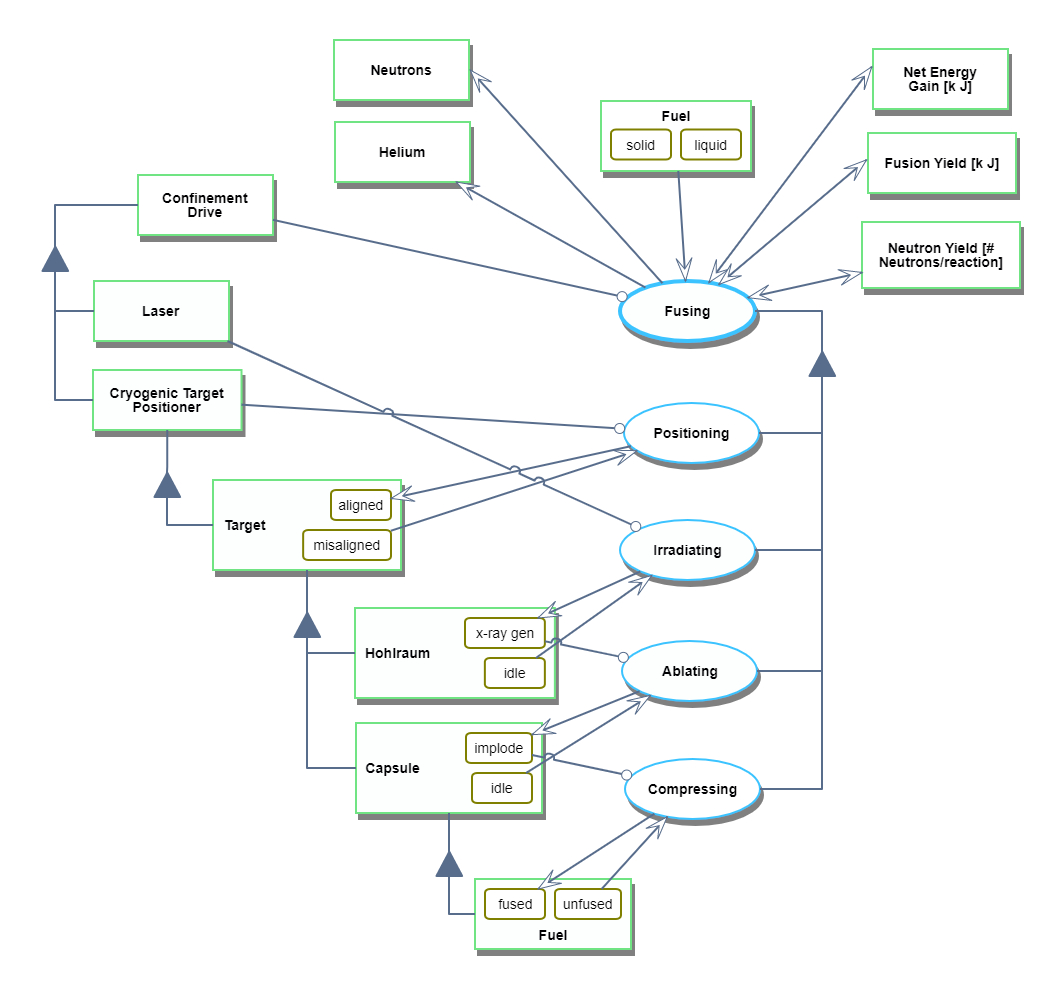
Unfolding the Fusing Process at level SD1
An Object-Process-Language (OPL) description of the roadmap scope is auto-generated and given below. It reflects the same content as the previous figure, but in a formal natural language.
Figures of Merit
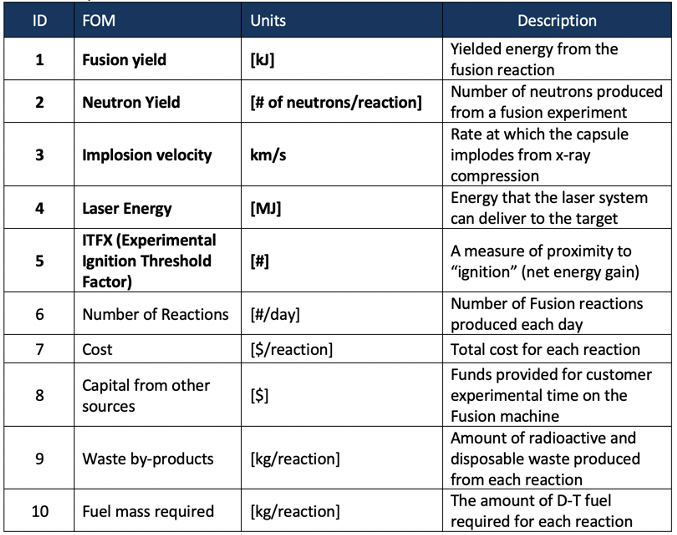
The table below shows a list of FOMs by which Laser Confined Nuclear Fusion, LCNF can be assessed. FOMs on this list related specifically to fusion reactions, such as neutron and fusion yield are similar to other confined fusion experiments. For LCNF, the key FOMs are experiment implosion velocity, laser energy and neutron yield. Fusion yield is intrinsically related to neutron yield.
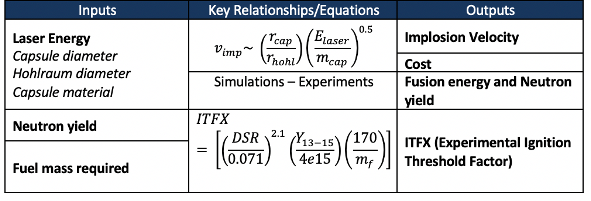
Important FOMs such as implosion velocity and ITFX can be calculated from the equations in the table below. However, an understanding of neutron yield and thus fusion yield is found through both simulations and experiments in LCNF facilities.
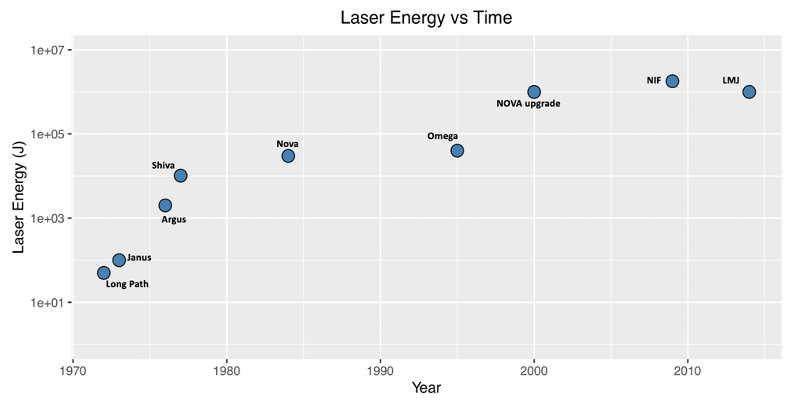
Over the last 50 years, development of LCNF facilities enabled increases in laser energies (delivered to D-T fuelled targets) by 5 orders of magnitude. The National Ignition Facility, NIF at LLNL contains the world's most powerful laser.
Alignment with Company Strategic Drivers
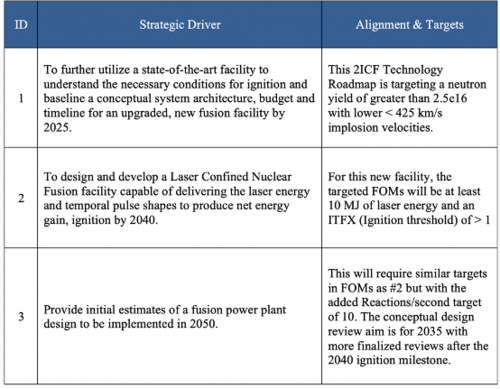
Our “company” is a government contractor that is looking to improve near term efficiencies and gains in Laser Confined Nuclear Fusion as well as develop the next generation world-class laser facility. This will not only aid in further development of harnessing fusion as an alternative renewable energy source but also allow for a suite of improved quality experiments for stockpile stewardship. The table below shows the three main strategic drivers and the necessary alignment of the 2ICF technology roadmap with them.
Positioning of Company vs. Competition
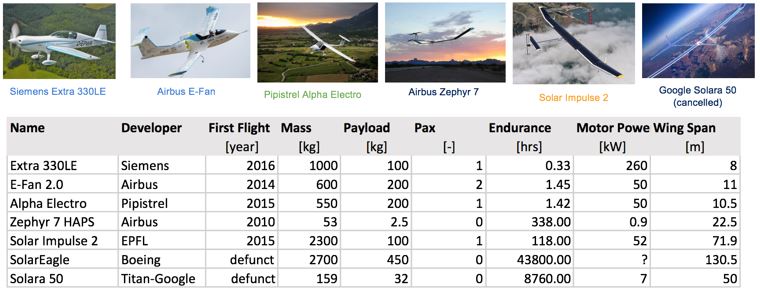
The figure below shows a summary of other electric and solar-electric aircraft from public data.
The aerobatic aircraft Extra 330LE by Siemens currently has the world record for the most powerful flight certified electric motor (260kW). The Pipistrel Alpha Electro is a small electric training aircraft which is not solar powered, but is in serial production. The Zephyr 7 is the previous version of Zephyr which established the prior endurance world record for solar-electric aircraft (14 days) in 2010. The Solar Impulse 2 was a single-piloted solar-powered aircraft that circumnavigated the globe in 2015-2016 in 17 stages, the longest being the one from Japan to Hawaii (118 hours).
SolarEagle and Solara 50 were both very ambitious projects that aimed to launch solar-electric aircraft with very aggressive targets (endurace up to 5 years) and payloads up to 450 kg. Both of these projects were canceled prematurely. Why is that?
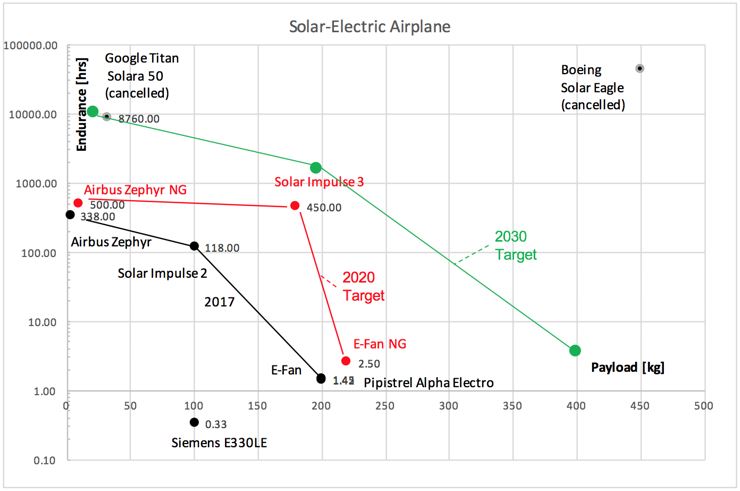
The Pareto Front (see Chapter 5, Figure 5-20 for a definition) shown in black in the lower left corner of the graph shows the best tradeoff between endurance and payload for actually achieved electric flights by 2017. The Airbus Zephyr, Solar Impulse 2 and Pipistrel Alpha Electro all have flight records that anchor their position on this FOM chart. It is interesting to note that Solar Impulse 2 overheated its battery pack during its longest leg in 2015-2016 and therefore pushed the limits of battery technology available at that time. We can now see that both Solar Eagle in the upper right and Solara 50 were chasing FOM targets that were unachievable with the technology available at that time. The progression of the Pareto front shown in red corresponds to what might be a realistic Pareto Front progression by 2020. Airbus Zephyr Next Generation (NG) has already shown with its world record (624 hours endurance) that the upper left target (low payload mass - about 5-10 kg and high endurance of 600+ hours) is feasible. There are currently no plans for a Solar Impulse 3, which could be a non-stop solar-electric circumnavigation with one pilot (and an autonomous co-pilot) which would require a non-stop flight of about 450 hours. A next generation E-Fan aircraft with an endurance of about 2.5 hours (all electric) also seems within reach for 2020. Then in green we set a potentially more ambitious target Pareto Front for 2030. This is the ambition of the 2SEA technology roadmap as expressed by strategic driver 1. We see that in the upper left the Solara 50 project which was started by Titan Aerospace, then acquired by Google, then cancelled, and which ran from about 2013-2017 had the right targets for about a 2030 Entry-into-Service (EIS), not for 2020 or sooner. The target set by Solar Eagle was even more utopian and may not be achievable before 2050 according to the 2SEA roadmap.
Technical Model
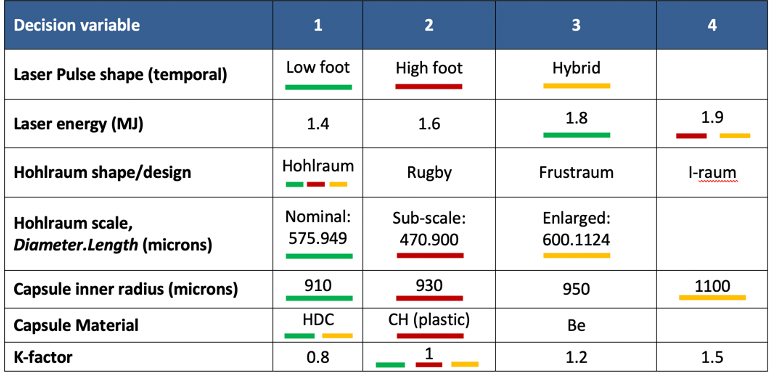
In order to assess the feasibility of technical targets at the level of the 2ICF roadmap it is necessary to develop a technical model. In order to understand important design decision variables for Laser Confined Nuclear Fusion, research was conducted. We found from data that there are at least seven key variables that must be considered. The table below shows these along with the unique choices for each.
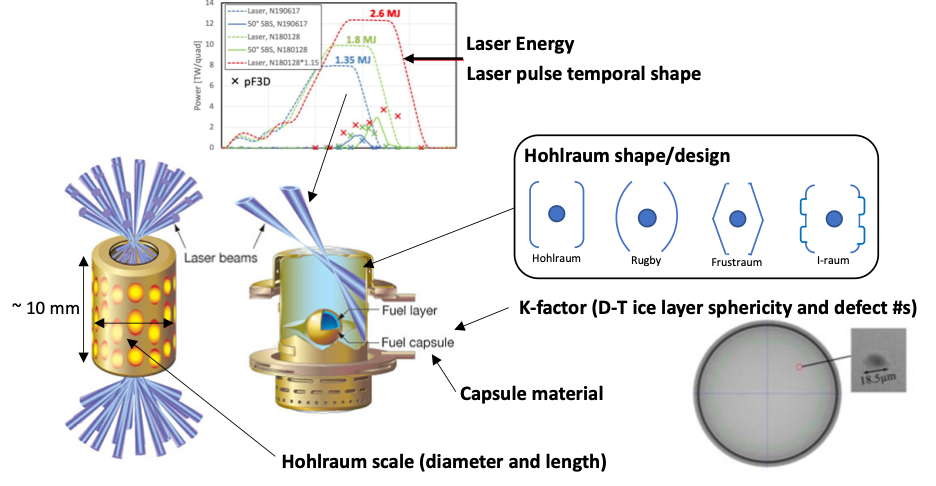
The figure below was created to better explain each of decision variables in pictorial form. There are 2 variables for the laser system. These are the UV light energy delivered to the target and the temporal shape at which this energy is delivered. A further two variables pertain to the Hohlraum structure in terms of size (scale) and design shape. The Hohlraum is utilized in indirect drive laser confined nuclear fusion experiments to covert the UV light into x-rays that compress the fuel capsule. The remaining three variables cover the capsule radius, material, and a variable for the D-T (Deuterium-Tritium) fuel ice-layer known as the K-factor. This factor provides a normalized number for the summation of all defects and sphericity of the ice layer. It essentially indicates a fuel quality with 1 being optimal.
As the National Ignition Facility, NIF is at the forefront of Laser Confined Nuclear Fusion, the subsequent data gathered is all from NIF. No other facility is currently able to produce anywhere near the laser energies and neutron yields. The table below shows three experiments conducted over the last 7 years, important decision variables and the resulting neutron yield and implosion velocity FOMs. These are colored keyed such that they relate back to the variables shown in morphological matrix.
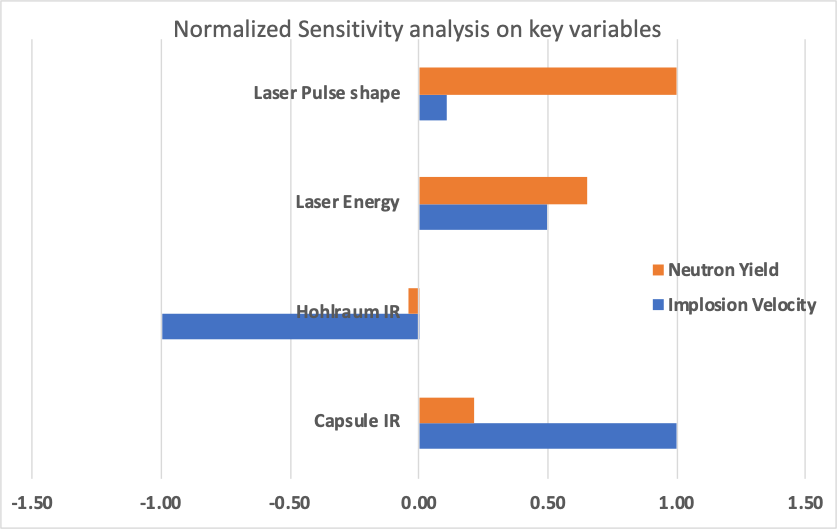
Implosion velocity and neutron yield are the two FOMs that were explored in a sensitivity analysis. To assess the former FOM, partial derivatives of the velocity implosion were calculated with respect to the capsule inner radius, hohlraum inner radius and laser energy. From these partial derivative equations, we can calculate the change in implosion velocity from unit changes of each variable. It is important to note that the NIF experiment, N180128 was used as the benchmark. This experiment had an implosion velocity of 425 km/s and neutron yield of 1.8e16. When understanding the neutron yield sensitivity to these same four parameters (above), experimental data gathered from NIF over the last 10 years had to be used. The plot below shows the sensitivity results for implosion velocity and neutron yield with respect to four chosen decision variables.
Key Publications, Presentations and Patents
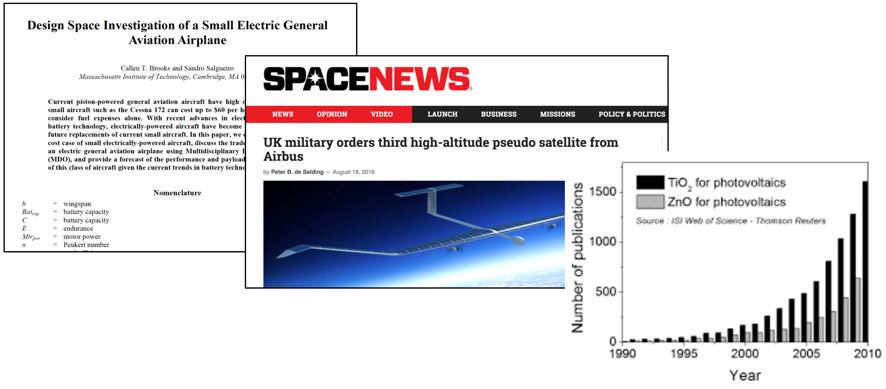
A good technology roadmap should contain a comprehensive list of publications, presentations and key patents as shown in Figure 8-19. This includes literature trends, papers published at key conferences and in the trade literature and trade press.
