Difference between revisions of "Smart Grid Home Area Network for Dynamic Pricing and Demand Management, by Kulkarni, Ozturk, Toeldte"
| Line 13: | Line 13: | ||
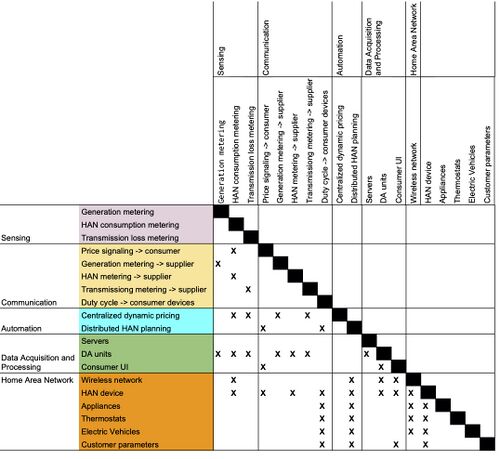
This DSM depicts components of the Energy Management System and their interactions. | This DSM depicts components of the Energy Management System and their interactions. | ||
[[File:DSM-SmartGrid.jpg]] | [[File:DSM-SmartGrid.jpg|500px]] | ||
===[[Object Process Diagram - OPD]]=== | ===[[Object Process Diagram - OPD]]=== | ||
Revision as of 15:43, 1 October 2020
Project Overview
The proposed smart grid system uses data from sensors at the Home Area Network (HAN) level to make optimal dynamic pricing decisions for electricity, as well as modulating the power consumption of smart devices.
These kinds of energy control technologies have become more important as we move towards an increased share of intermittent renewable energies in electricity generation, and increasingly electrify domains such as transportation and home heating. Inefficient supply and demand matching in electricity generation can result in large plant-to-plug energy losses, on top of the unavoidable transmission losses.
The technology uses data at the generation level and consumer level to make predictions about future energy supply and demand. In case of imbalance, the technology provides price signals to Home Area Networks, which automatically make energy consumption decisions based on some parameters that the consumer determines, taking advantage of the price elasticity of demand for electricity to bring the system back into balance. Furthermore, the technology would inform consumers about their energy use patterns, and the share of electricity sourced by renewables. This would both allow firms to make more profit and/or displace consumer demand to times that have a higher availability of renewable energies, reducing the environmental footprint of electricity.
Large scale smart grid technologies could also better schedule the ramp up/down of nonrenewable sources, and take advantage of the key performance indicators (KPIs) of available energy resources to optimally allocate the duty cycle of potential energy sources. This is however outside the scope of our work.
DSM Allocation
This DSM depicts components of the Energy Management System and their interactions.
Object Process Diagram - OPD
This Object Process Diagram depicts how the Energy Management System at the Home Area Level works.
