Difference between revisions of "Retail Payment system"
| Line 130: | Line 130: | ||
==Technical model== | ==Technical model== | ||
<ref> | |||
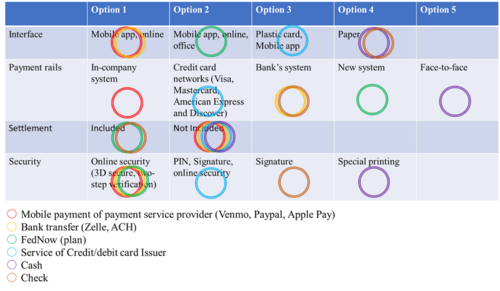
[[File:Payment system Morphological Matrix.png|500px|thumb|center]] | |||
</ref> | |||
For payment systems, the technologies already exist to process a payment near real-time (near real-time is real time with network latency). | For payment systems, the technologies already exist to process a payment near real-time (near real-time is real time with network latency). | ||
Revision as of 04:18, 30 October 2020
Technology Roadmap
Roadmap Overview
The U.S. financial system processes millions of transactions each day to facilitate purchases and payments. In general terms, a payment system consists of the means for transferring money between suppliers and users of funds through the use of cash substitutes, such as checks, drafts, and electronic funds transfers.
A payment system is a system exchanges / trades value by changing the ownership of money. It consists of a set of instruments, banking procedures, and, typically, interbank funds transfer systems that ensure the circulation of money. These systems allow for the processing and completion of financial transactions.
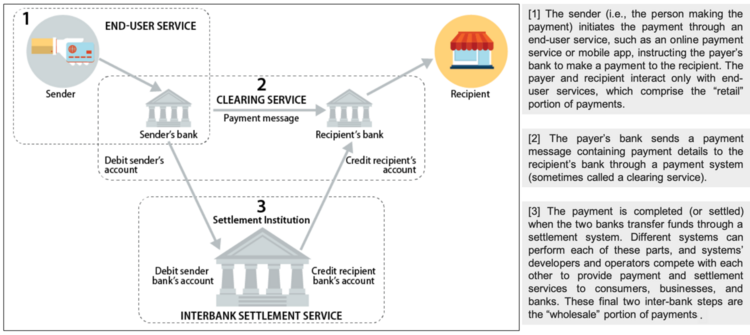
From the typical consumer’s perspective, making a payment is simple. A person swipes a card, clicks a button, or taps a mobile device and the payment is approved within seconds. However, the infrastructure and technology underlying the payment systems are substantial and complex. To simplify, a payment system has three parts (see Figure below).
*image-source - U.S. Payment System Policy Issues: Faster Payments and Innovation, Congressional Research Service (2019)
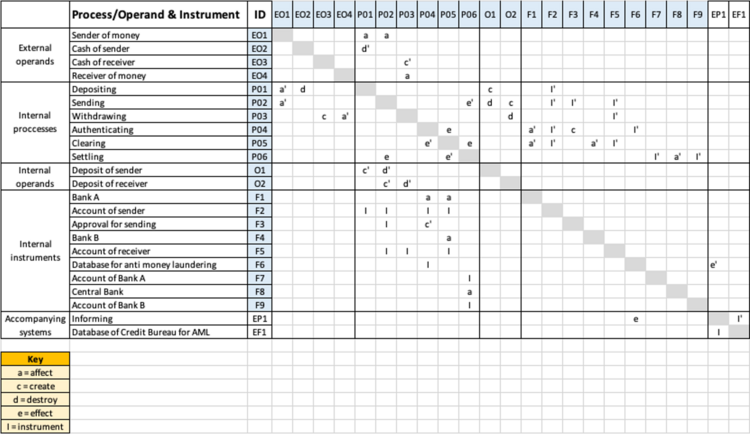
Design Structure Matrix (DSM) Allocation
The DSM of the Retail Payment System provided by banks is depicted in the image below.
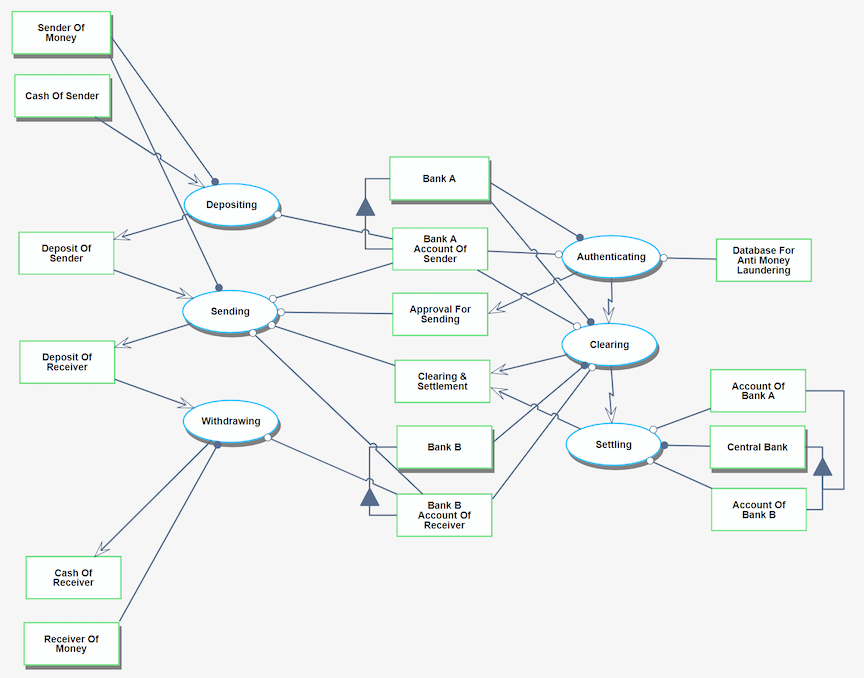
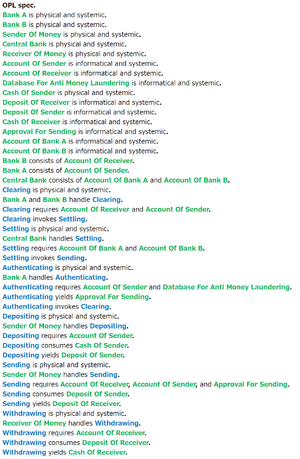
Object Process Model (OPM)
The OPM diagram captures the main object of the roadmap, its decomposition into systems (squares), as well as the main processes (ovals).
Figures of Merit (FOM)
The table below show a list of FOMs by which can assess a Payment System
| Class | Figure of Merit | Units |
|---|---|---|
| Performance | Value of transactions processed per annum | [US$] |
| Productivity | Number of transactions processed per annum | # of transactions processed per country, per individual or business client type |
| Efficiency | Average cost per transaction | [US cents] |
| Transaction settlement period | [Seconds] | |
| Reliability | System downtime per year | [Seconds] |
| Payment conversion rate | [%] | |
| Safety & Security | Sustainability ratio | [%] of Gross Operating Income that is spend on events to ensure the system is safe, secure and available to users. This ratio includes fraud related losses, system availability, cyber attacks, non-compliance events and user security. |
Company Strategic Objectives
We identified strategic objectives that can stand the test of time. We want our clients to understand our that we are constant, unchanging, something they can depend on. As technology improves, we can change the respective FOM and targets, without changing our strategic objectives. The table below shows our strategic objectives:
| Strategic Objective | Alignment and Targets |
|---|---|
| An efficient payment system that processes and settles transactions in near real-time. | Currently we have a transaction settlement period of 1 day and aim to decrease this to 90 seconds. |
| Our clients trust us to process their transactions in a safe and secure manner where they do not lose money. | We aim to maintain a Sustainability ratio that is lower than our 0.1% target of Gross Operating Income. |
| Our clients can make payments to anyone, anywhere. | We continue to grow the number of payments we process pa to more than [1bn], servicing more than [750k] individual and [10k] business clients in [76] countries. Our goal is to process 1% of all payments made as reported by the Bank of International Settlements (currently we are at 0.57%). |
Positioning of Company vs. Competition
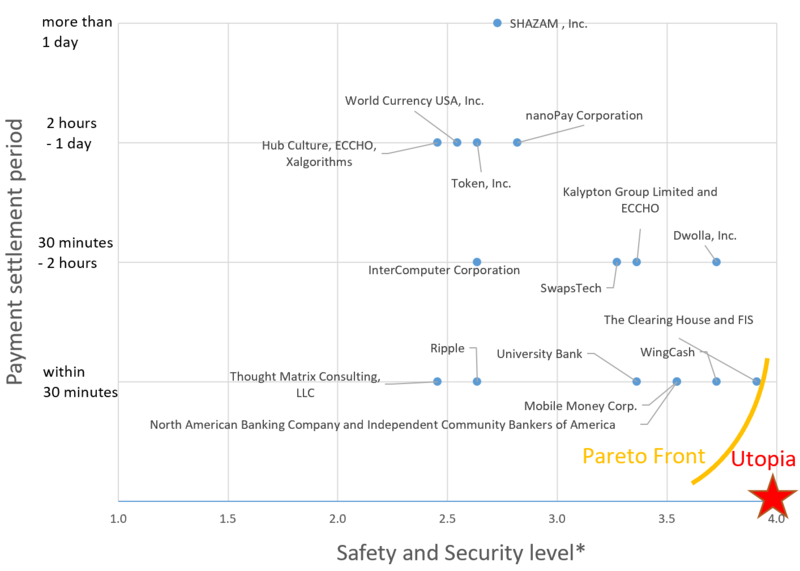
The following figure shows the tradespace of the faster payment services. Due to the limitation of data, we used “Safety and Security level*” as the alternative of FOM related to Safety & Security.
* We calculated “Safety and Security level” as the average level of assessment results for the following assessment objects.
Assessment objects:
S.1 Risk Management
S.2 Payer Authorization
S.3 Payment Finality
S.4 Settlement Approach
S.5 Handling Disputed Payments
S.6 Fraud Information Sharing
S.7 Security Controls
S.8 Resiliency
S.9 End-User Data Protection
S.10 End-User/Provider Authentication
S.11 Participation Requirements
The number of levels is defined as follows.
Levels:
4: Very Effective
3: Effective
2: Somewhat Effective
1: Not Effective
Technical model
<ref>
</ref>
For payment systems, the technologies already exist to process a payment near real-time (near real-time is real time with network latency).
The main challenge within the payment industry is to comply with the relevant regulatory requirements. Various acts are relevant to the payment industry, including Anti-Money Laundering (which is used to combat drug trafficking), Cross-border Terrorist Financing (used to combat terrorism) and the Foreign Account Tax Compliance Act (where the US requires all non-U.S. foreign financial institutions to search and monitor their records for customers with a connection to the U.S.). These regulations require payment systems to enforce additional controls within their networks to ensure compliance.
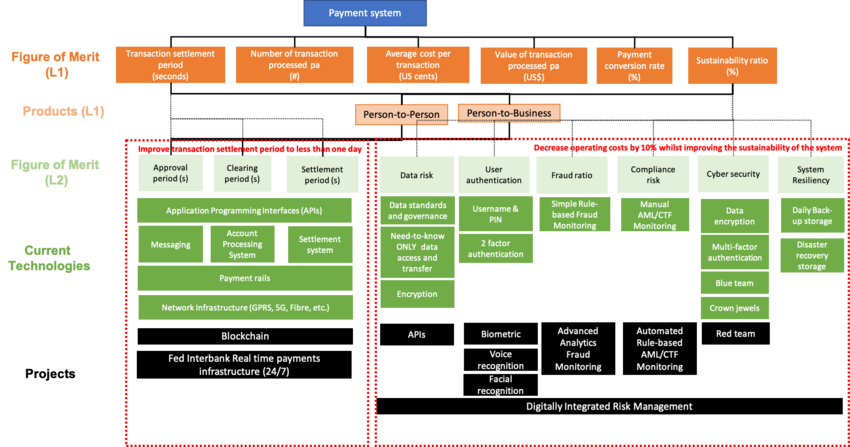
We adopted a top-down and bottom-up approach to identify projects that can pull specific technologies to new capability levels that can best assist in achieving strategic objectives. Due to the unknown regulatory requirements that may impact a specific project, a high-level technical model estimate was performed for various different opportunities (opposed to selecting only one project).
For our company, the following strategic objectives were determined for the company to be pursued in the following year:
- Improve the transaction settlement period to less than one day; and
- Decrease operating costs by 10% whilst improving the sustainability of the system (the relevant FOMs for this objective are to decrease average cost per transaction whilst decreasing / maintaining the Sustainability ratio)
A two-level decomposition was performed to identify which technologies can be enhanced to achieve these objectives as per below:
Below are descriptions for each of the projects:
| # | Level 1 FOM | Project Name | Description |
|---|---|---|---|
| 1 | Transaction settlement period | Block chain | Build new blockchain infrastructure to facilitate fast, secure, low-cost local and international payment processing services (and other transactions) through the use of encrypted distributed ledgers that provide trusted real-time verification of transactions without the need for intermediaries such as correspondent banks and clearing houses |
| 2 | Transaction settlement period | Fed Interbank real-time payments infrastructure | The Fed has committed to a new real-time payments platform that would enable financial institutions in the U.S. to clear and settle transactions in virtually instantaneous fashion to be completed by 2023/2024. Our payment system is to integrate with this new platform. |
| 3 | Sustainability ratio | Application Programming Interfaces (APIs) | Open Banking will require financial institutions to open their data for third parties to access and consume. By developing standardized APIs, we can ensure our clients data is safe, secure and only the relevant data is provided when third parties requires access. |
| 4 | Sustainability ratio | Biometric Authentication | Clients can access our payment systems by using fingerprints (opposed to PIN) |
| 5 | Sustainability ratio | Voice recognition | Clients can access our payment systems by using their voices (opposed to PIN) |
| 6 | Sustainability ratio | Facial recognition | Clients can access our payment systems by using their face (opposed to PIN) |
| 7 | Sustainability ratio | Advanced analytics - fraud monitoring | The current false-positive irate in fraud detection is greater than 40%. This should be reduced to 20% by using more advance analytical techniques, and create resource capacity to investigate actual fraud cases. Advanced analytics can also detect and take mitigating action in real-time to decrease client related fraud losses by 30%. |
| 8 | Sustainability ratio | Advanced analytics - AML/CTF monitoring | The current false-positive irate in AML/CTF detection is greater than 90%. This should be reduced to 60% by using advance analytical techniques. |
| 9 | Sustainability ratio | Red team | Recruit a red team (consisting of ethical hackers) to continuously identify and attack cyber security vulnerabilities. |
| 10 | Sustainability ratio | Digitally integrated risk management | Integrate respective risk monitoring performance indicators into system processes and automate reporting. |
Each project was quantified and a "Net Impact score per dollar". This equation utilizes the following variables:
- The project cost (C) is estimated, utilizing an algorithmic project management software application (example SEER);
- The percentage feasibility (F) of project success is determined by combining expert SME and technologist opinion;
- The direct benefits (D) are real monetary benefits (e.g. increased revenue, cost reductions) to be realized by the project which the project sponsor commits to realize; and
- Indirect benefits (I) are other risk or economic related benefits which will not directly impact the company’s net profit, but will create a more sustainable system (e.g. reduce the risk profile of the system, avoid regulatory fines and losses, etc.)
The "Net Impact score per dollar" was calculated as follow:
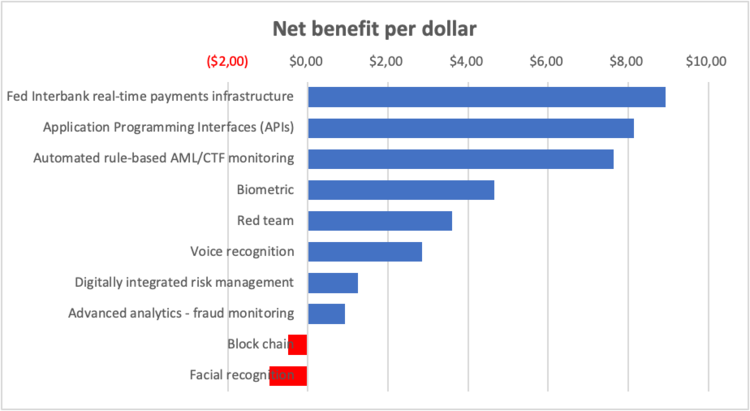
This resulted in the following tornado diagram being generated:
Based on the assumptions and commitments in the respective scores, the following benefits will be realized at the Level 1 FOM level:
- The transaction settlement will decrease to less than a day; and
- Enabling an open banking API capability will decrease the likelihood of incurring a GDPR fine or penalty and improve our sustainability ratio by 0.5%.
Patents and papers
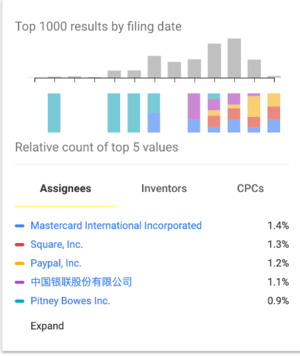
Extensive information is available pertaining to "payment systems":
- Google Scholar yielded 31,800 results when searching for “Payment System” from 2016 (excluding references in citations and patents).
- Google Patents yielded 95,500 results. More than half of these were generated from 2010.
- U.S. Trademark and Patent Office yielded 406 results in “Payment System”.
- MIT Libraries yielded the following results for a “Payment System” search: Books and media (88,910), Articles and journals (131,263) and Archives and manuscripts (62)
Other credible sources of public information include:
- US Federal Reserve (Fed)
- World Bank Group
- Bank of International Settlements (BIS)
Examples of patents:
- System and method for linking payment card to payment contract (United States 3,778,595 on 11 December 1973) by Yoshihiro Hatanaka and Akio Ueba. This is the initial patent for an Automatic Bank Teller (ATM) system.
- Methods and systems for IOT enabled payments (US 2018/0197175) by Mastercard International Corporation. The patent addresses a method and system for placing and processing orders for a product in which the processing of the payment is delayed until the product has been successfully received.
- Digital fiat currency (US 2020/0151682) by Visa International Service Association. Techniques are disclosed which include receiving, by a central entity computer, a request for digital currency.
- Dynamic provisioning of wallets in a secure payment system (US 2020/0065819) by Radpay , Inc. The patent describe methods and systems for securely conducting a transaction requiring approval via a personal device of a purchaser is provided.
Examples of papers:
- U.S. Payment System Policy Issues: Faster Payments and Innovation (September 23, 2019) by Cheryl R. Cooper, Marc Labonte and David W. Perkins on behalf of the Congressional Research Reserve. This report examines technological innovation in US payment systems generally and particular policy issues as a result of retail (i.e, point of sale) payment innovation.
- Fast payments – Enhancing the speed and availability of retail payments (November 2016), by the Committee on Payments and Market Infrastructures from the Bank of International Settlements. This report highlights the role central banks can take in a the payment system: a catalyst role, an oversight role, and an operational role. It also reaffirms the role and how central banks should enable and support faster payment systems.
- The U.S. path to faster payments - PART ONE (January 2017), by the Faster Payments Task Force. The paper describes the task force’s mission and process, and provides greater detail about the motivation behind the task force’s work in the context of the current payments landscape — explaining why the task force came together to identify and evaluate effective faster payments solutions in the United States.
- The U.S. path to faster payments - PART TWO: A Call to Action (July 2017), by the Faster Payments Task Force. This second paper from the Faster Payments Task Force presents a roadmap for achieving safe, ubiquitous, faster payments that encourages competition among a variety of solutions, as opposed to endorsing a single approach.
